There are multiple dimensions we usually want to achieve and monitor in our codebases: Functional correctness (works as intended), architectural fitness (is fast/secure/usable enough), and maintainability. I define maintainability here as making it easy and low risk to change the codebase over time – also known as “internal quality”. So I don’t only want to be able to make changes quickly today, but also in the future. And I don’t want to worry about introducing bugs or degradation of fitness every time I make a change – or have AI make a change. I usually see the first signs of cracks in the maintainability of an AI-generated codebase when the number of files changed for a small adjustment increases. Or when changes start breaking things that used to work.
Internal quality problems affect AI agents in similar ways that they affect human developers. An agent working in a tangled codebase might look in the wrong place for an existing implementation, create inconsistencies because it has not noticed a duplicate, or be forced to load more context than a task should require.
In this article, I describe my experimentation with various sensors that help us and AI reflect on the maintainability of a codebase, and what I learned from that.
The application
I’m working on an internal analytics dashboard for community managers that reads chat space activity, engagement, and demographic data from a combination of APIs and presents the data in a web frontend.
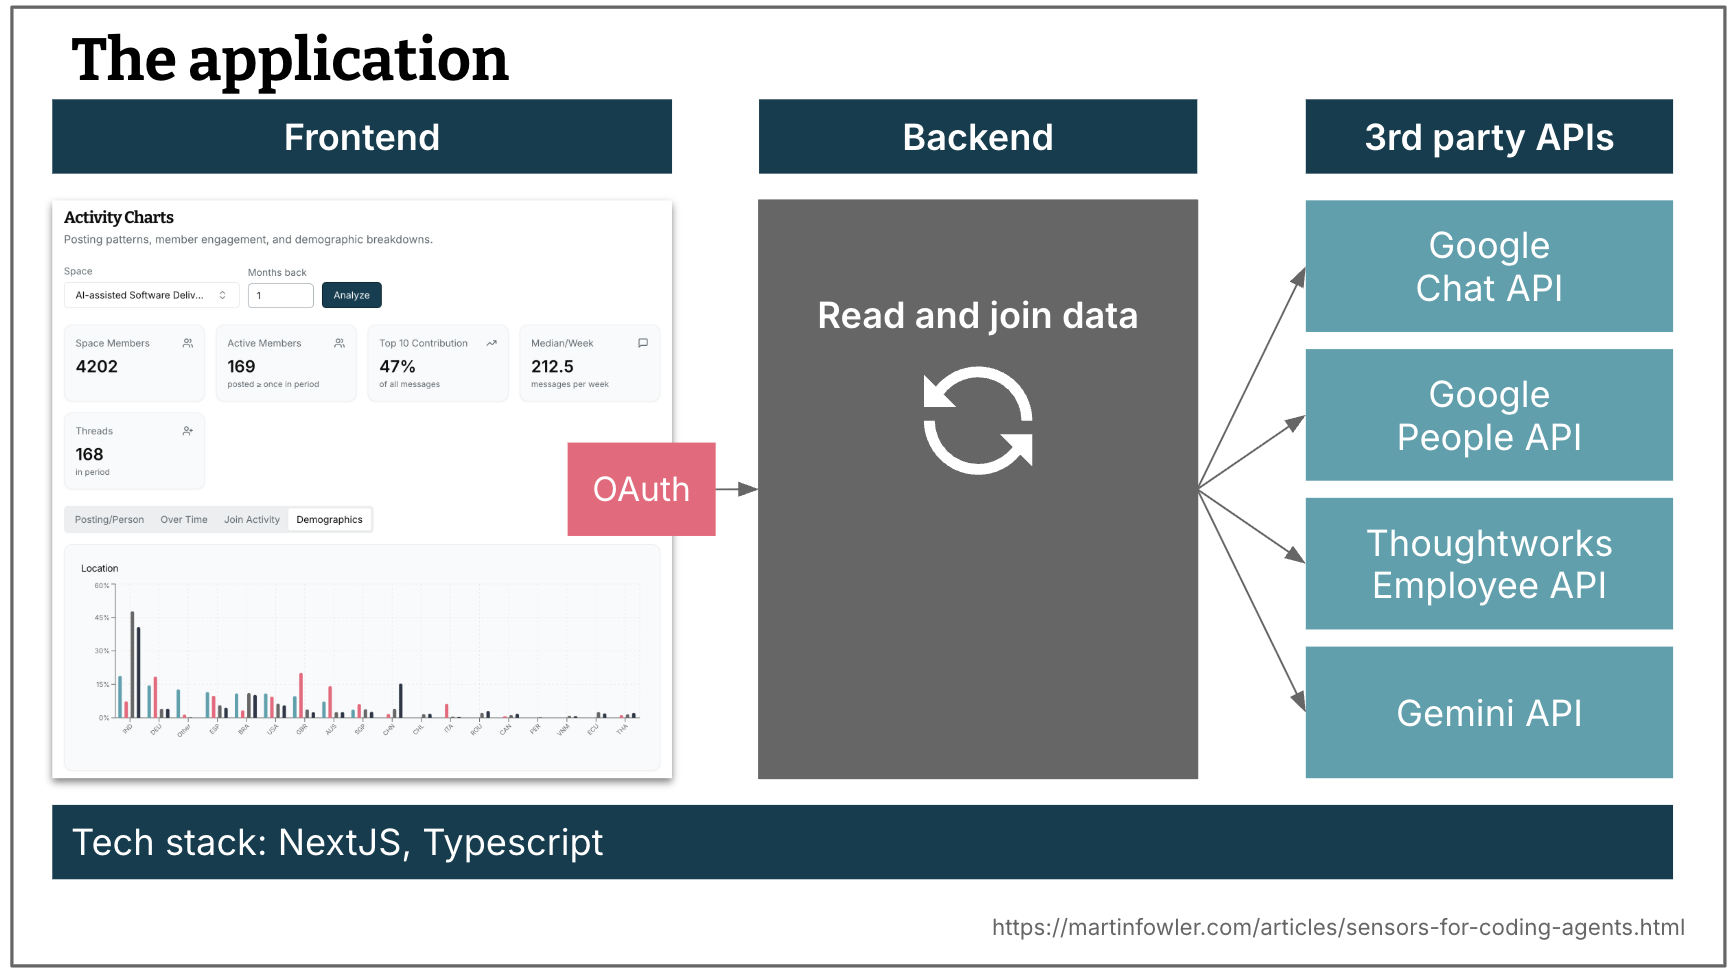
Figure 1:
The example app: web UI, service layer, and external APIs.
The tech stack is a TypeScript, NextJS, and React. The backend reads and joins data from the APIs. The application has been around for a while, but for the sake of these experiments I rebuilt it with AI from scratch.
There are hardly any guides (e.g. markdown files) for AI about code quality and maintainability present, I wanted to see how well it can do just by relying on sensor feedback.
Overview of all sensors used
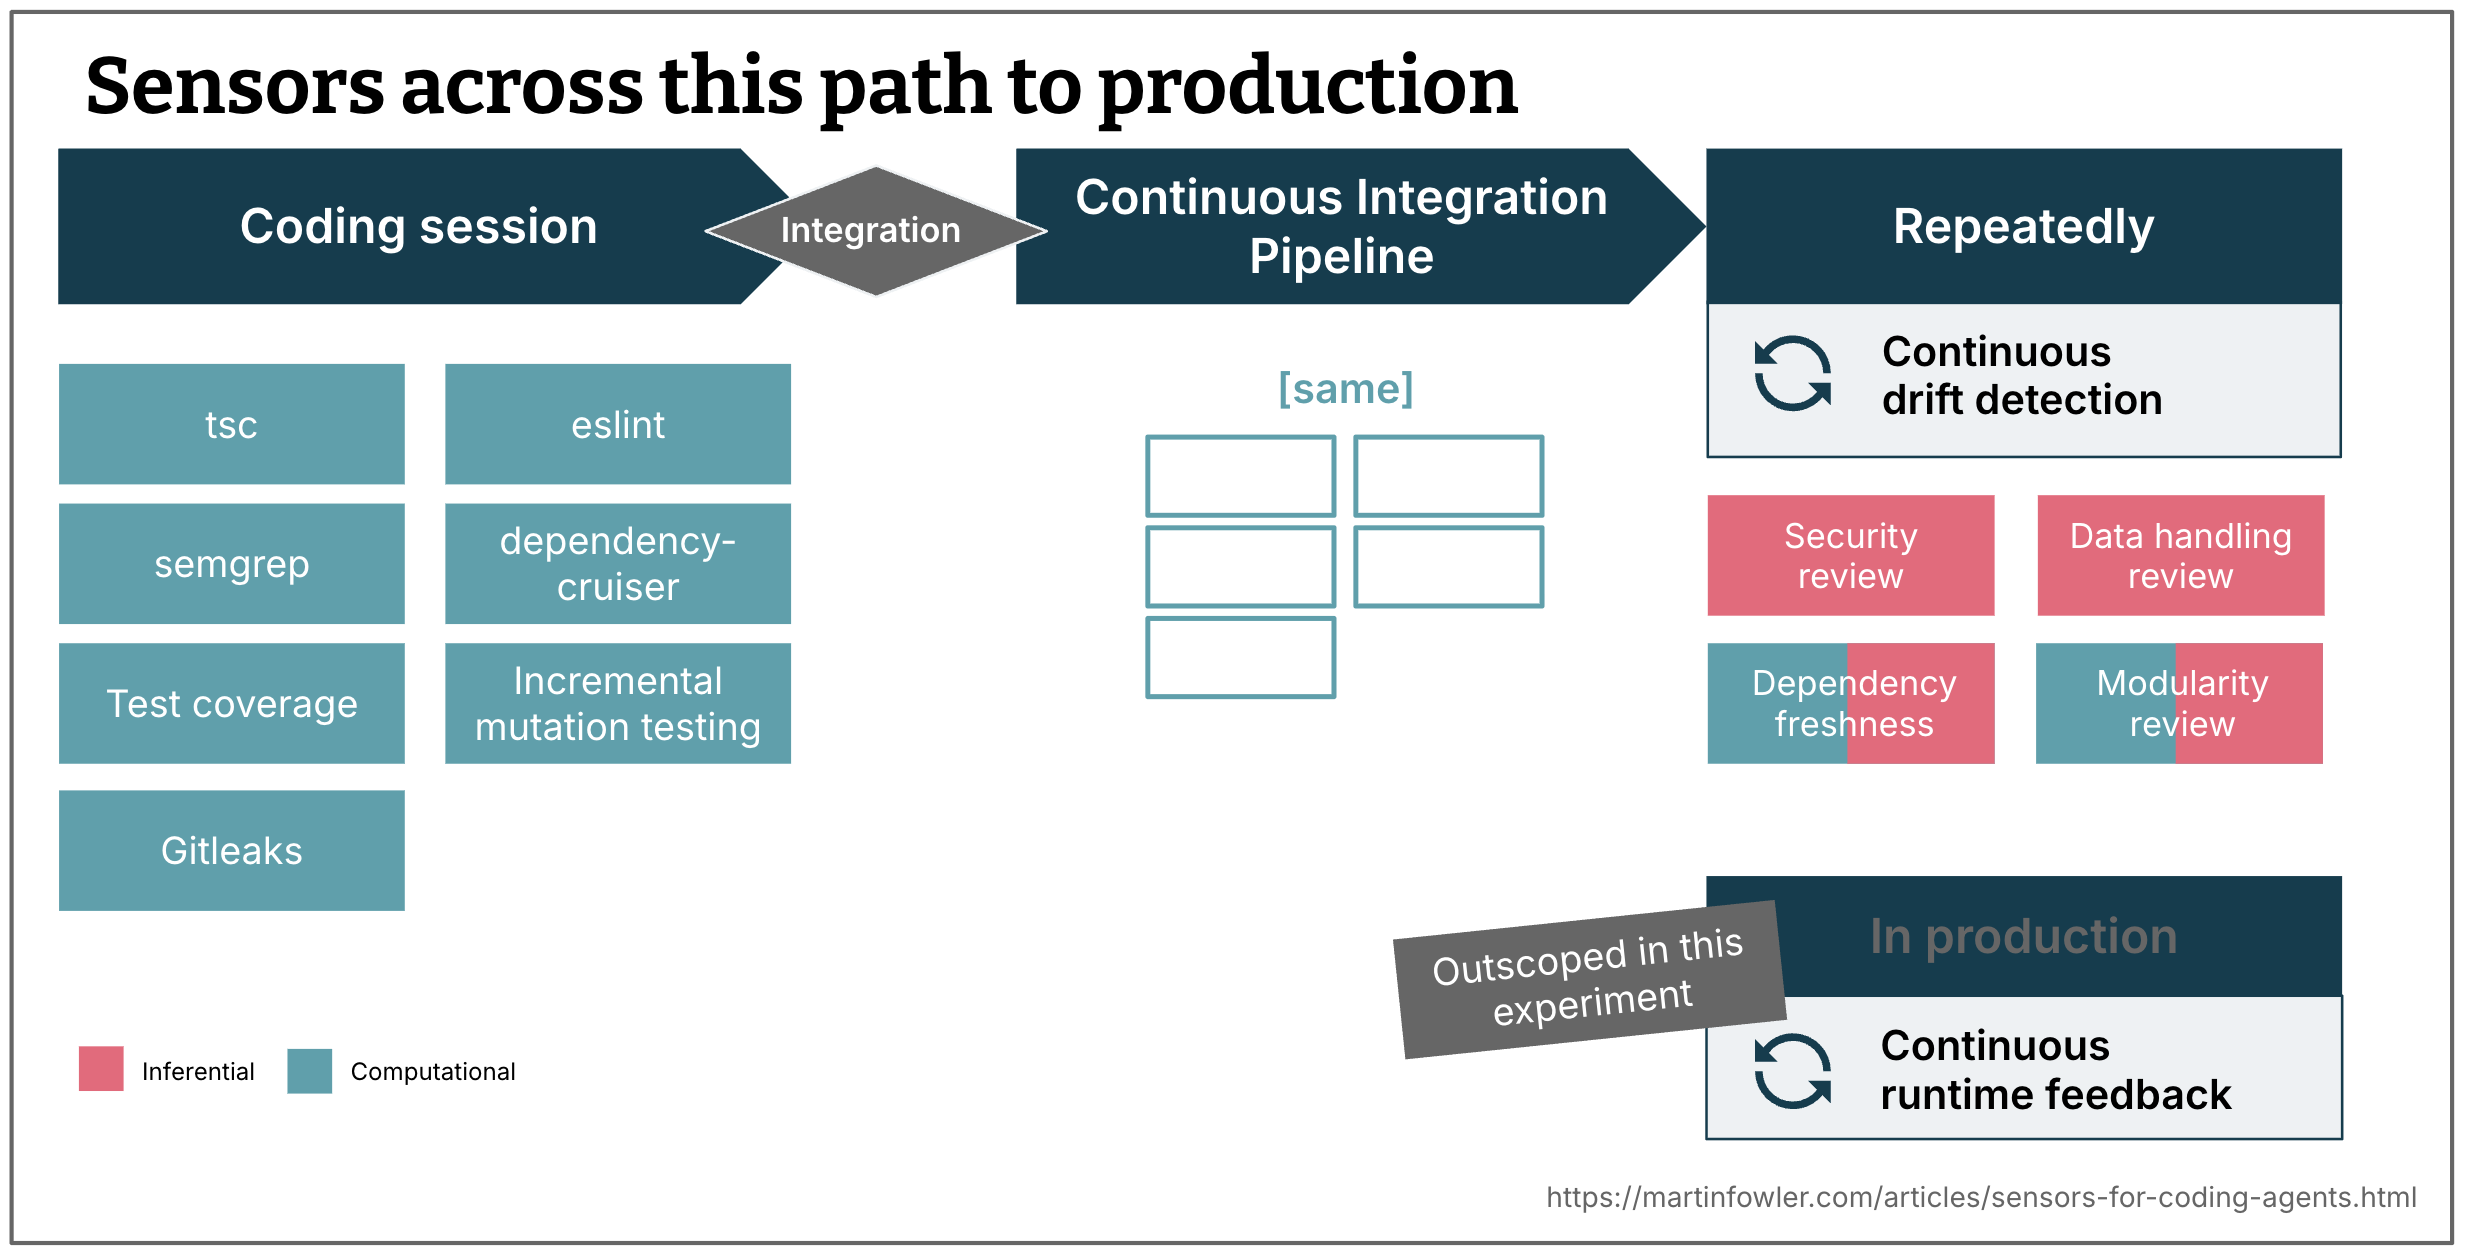
Figure 2:
Where sensors can run: during the initial coding session, in the pipeline, on a schedule, and in production.
This is an overview of the sensors I set up across the path to production.
During coding session
Sensors that run continuously alongside the agent to provide fast feedback.
- Type checker (computational)
- ESLint (computational)
- Semgrep, SAST tool prescribed by our internal AppSec team (computational)
- dependency-cruiser, runs structural rules to check internal module dependencies (computational)
- Test suite results including test coverage (computational – though the test suite is generated by AI, therefore created in an inferential way)
- Incremental mutation testing (computational)
- GitLeaks runs as part of the pre-commit hook, I consider it to be a sensor as well, as it will give the agent feedback when it tries to commit (computational)
After integration – pipeline
The same computational sensors run again in CI. The in-session sensors give the agent early feedback during development. The CI pipeline confirms the result on clean infrastructure and after integration.
Repeatedly
Sensors that run on a slower cadence to detect drift that accumulates over time, rather than errors that occur in the moment.
- A security review, prompt derived from our AppSec checklist for internal applications (inferential)
- A data handling review, prompt describes things like “no user names should ever be sent to the web frontend” (inferential)
- Dependency freshness report, which runs a script first to get the age and activity of the library dependencies, and then has AI create a report with recommendations about potential upgrades, deprecations, etc (computational and inferential)
- Modularity and coupling review (computational and inferential)
With this context out of the way, let’s dive into the first category of sensors.
Base harnesses and models
Throughout building the application, I used a mix of Cursor, Claude Code, and OpenCode (in that order of frequency). My default model was usually Claude Sonnet, for some of the planning and analysis tasks I used Claude Opus, and for implementation tasks I frequently used Cursor’s composer-2 model.
Static code analysis: Basic linting
I’ll start with my learnings from using ESLint in this application. Basic linting tools like ESLint mostly target maintainability risk at the level of individual files and functions.
Rules for typical AI shortcomings
In my experience, the AI failure modes that are the most low-hanging fruit for static code analysis are
- Max number of arguments for functions
- File length
- Function length
- Cyclomatic complexity
However, these weren’t even active in ESLint’s default preset, I had to configure maximums for them first. Hopefully, static analysis tools will evolve to provide better presets for usage with AI. A bit of research shows that people are also starting to publish ESLint plugins with rule sets that are specifically targeting known agent failure modes, like this one by Factory, with rules about things like requiring test files or structured logging.
Guidance for self-correction
A sensor is meant to give the agent feedback so that it can self-correct. Ideally, we want to give the agent extra context for that self-correction – a good kind of prompt injection. To do that, I built a custom ESLint formatter to override some of the default messages – with the help of AI of course, naturally.
Here is an example of my guidance for the no-explicit-any warning.
We want things to be typed to make it easier to avoid errors, especially for key concepts.
But we also want to avoid cluttering our codebase with unnecessary types. Make a judgment
call about this. If you choose to not introduce a type, suppress it with:
// eslint-disable-next-line @typescript-eslint/no-explicit-any -- (give reason why)`,
Managing warnings – now more feasible?
Static code analysis has been around for a long time, and yet, teams often didn’t use it consistently, even when they had it set up. One of the reasons for that is the management overhead that comes with it. Effective use of this analysis requires a team to keep a “clean house”, otherwise the metrics just become noise. In particular warnings like the no-explicit-any example above are tricky, because you don’t always want to fix them – it depends. And suppressing them one by one has always felt tedious, and like noise in the code.
With coding agents, we might now have a chance at that clean baseline. In the guidance text above, the agent is told to make a judgment call, and allowed to suppress a warning in the code. This keeps the suppressions manageable, visible and reviewable.
For thresholds, like the maximum number of lines, or the maximum allowed cyclomatic complexity, I told the agent in the lint message that it may slightly increase the thresholds if it thinks that a refactoring is unnecessary or impossible in a particular case. This doesn’t suppress the threshold forever, just increases it, so that the rule fires again if it gets even worse in the future. Constraints are preserved without forcing a binary suppress-or-comply choice.
Observations
- Looking at the exceptions AI created (suppressed warnings, increased thresholds) was a good point to start my code review.
- AI frequently decided to increase the cyclomatic complexity threshold, but suggested good refactorings when I nudged it further. It was the only category where it did that, and I later discovered that I didn’t have a self-correction guidance in place for this one, so there was no explicit instruction saying that a threshold increase should be the absolute exception. This is an indicator that the custom lint messages can indeed make quite a difference.
- Sometimes I want to treat rules differently in different parts of the code. Let’s take
no-console, telling AI off when it usesconsole.log. In the backend, I want it to use a logger component instead. In the frontend, I might want to not use direct logging at all, or at the very least I need to use a different logging component. This is another example of the power of the self-correction guidance, and where AI can help with semantic judgment and management of analysis warnings. - I was watching out for examples of trade-offs between rules. The only one I’ve seen so far was created by the
max-linesandmax-lines-per-functionrules. I’ve seen AI do quite a bit of useful refactoring and breakdown into smaller functions and components as a result of this sensor feedback. However, in the React frontend, I’m seeing a worrying trend of components with lots and lots of properties as a result of passing values through a growing chain of smaller and smaller components. I haven’t got useful observations yet about how good AI might be at making consistent decisions between tradeoffs like that.
Main takeaways
Overall, I was positively surprised by how many things I can cover with static analysis. I had to remind myself multiple times why it has been somewhat underused in the past, and what has changed: The cost-benefit balance. Cost is reduced because it’s much cheaper to create custom scripts and rules with AI. And the benefit has also increased: the analysis results help me get a first sense of lots of hygiene factors that wouldn’t even happen that much when I write code myself, so I can get common AI mistakes out of the way.
However, I can’t help but wonder if this can also lead to a false sense of security and an illusion of quality. After all, another reason why linters like this have been less used in the past is that they have limits, and we have been wary of using them as a simplified indicator of quality. There are lots of more semantic aspects of quality that static analysis cannot catch, it remains to be seen if AI can adequately fill that gap in partnership with those tools. I also discovered new supposed issues in the code every time I activated a new set of rules. It was always a mix of irrelevant things and things that actually matter. So I worry about feedback overload for the agent, sending it into a spiral of over-engineered refactorings.
Static code analysis: Dependency rules
Basic linting is mostly focussed on quality and complexity within a file or function. Next I started looking into sensors that could give me and the agent feedback about maintainability concerns that cross file and module boundaries. Analysis tools in this area are historically even more underused than the basic linting.
To learn about the potential of sensors that can help us and AI keep up good modularity inside of a codebase, I explored three things:
- Dependency rules (deterministic)
- Coupling analysis (deterministic and inferential)
- Modularity review (inferential)
Let’s start with dependency rules. I worked with the agent to come up with a layered module structure for my application, about half way through implementing it. I asked it to help me write dependency-cruiser rules to enforce these layers.
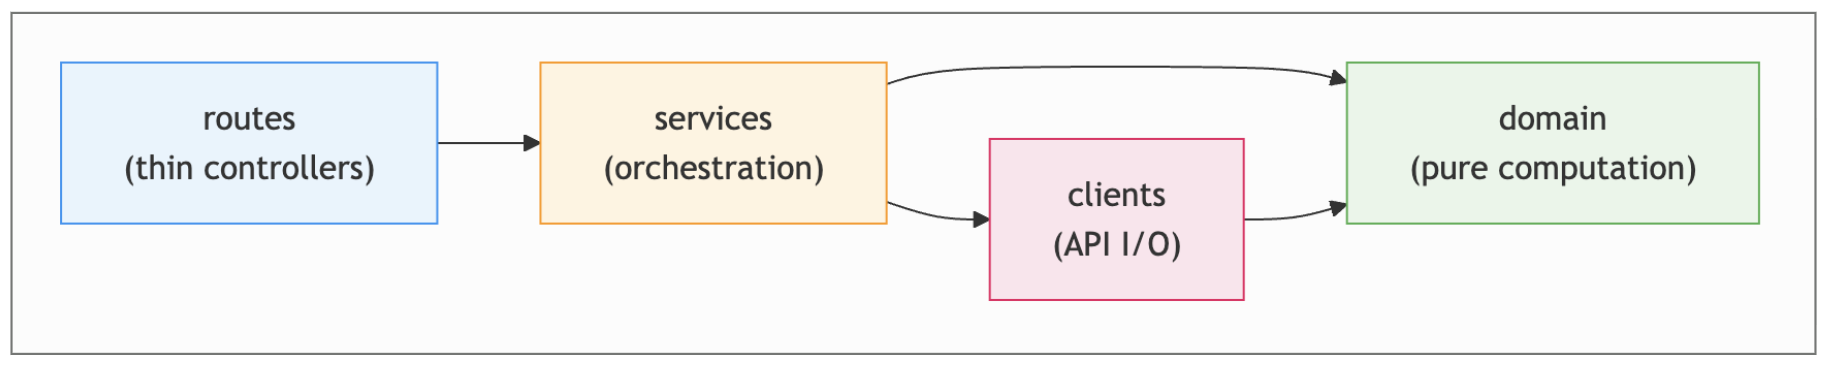
Figure 3:
Layered module structure and dependency rules
For example, one of the rules enforces that code in the clients folder never imports anything from the services folder:
{
  name: “clients-no-services”,
  comment:
    “API clients must not depend on the orchestration layer above them. “ + LAYERS,
  severity: “error”,
  from: { path: “^server/clients/”, pathNot: “/__tests__/” },
  to: { path: “^server/services/” },
},
As with the ESLint messages, I also expanded the error messages a bit to be self-correction guidance, recapping the layering concept as a whole:
ERROR  clients-no-services
  API clients must not depend on the orchestration layer above them.
  [Layers: routes -> services -> clients + domain; Services orchestrate: fetch data via clients, compute via domain -- no I/O, no SDKs, no knowledge of data fetching.]
Observations
- Without AI, I would not have gotten these rules in place quickly. The tool’s configuration syntax has a steep entry cost, and AI absorbed that cost almost entirely.
- The agent violated the rules a handful of times after I introduced them, and then self-corrected based on
dependency-cruiserfeedback, so it did help keep my folder concepts. - I also used the same approach to introduce conventions for how React hooks should be structured in the frontend.
- I had to figure out how to catch things when AI starts creating new folders outside of this structure, with a rule that requires every new file to be somewhere in the predefined folder structure.
Main takeaways
At the point when I introduced these rules, the structuring of code into folders had already become a little bit haphazard. I could see how the rules helped the agent clean that up, and then continue enforce these layers going forward. So I’ve found it quite a useful replacement for describing code structure in a markdown guide. However, tools like this are limited to what is expressible via imports, file names, and folder structure.
Static code analysis: Coupling data
Next, I experimented with the extraction of typical coupling metrics from my codebase, i.e. the number of incoming and outgoing imports and calls per file.
I didn’t use any existing tools for this, instead I had a coding agent write an application that creates those metrics with the help of the typescript compiler, so that I could have maximum flexibility to play around with this as part of my experimentation. I had it add two interfaces: A web interface with a bunch of different visualisations of those metrics for my own human consumption. And a CLI that can provide those metrics to a coding agent.
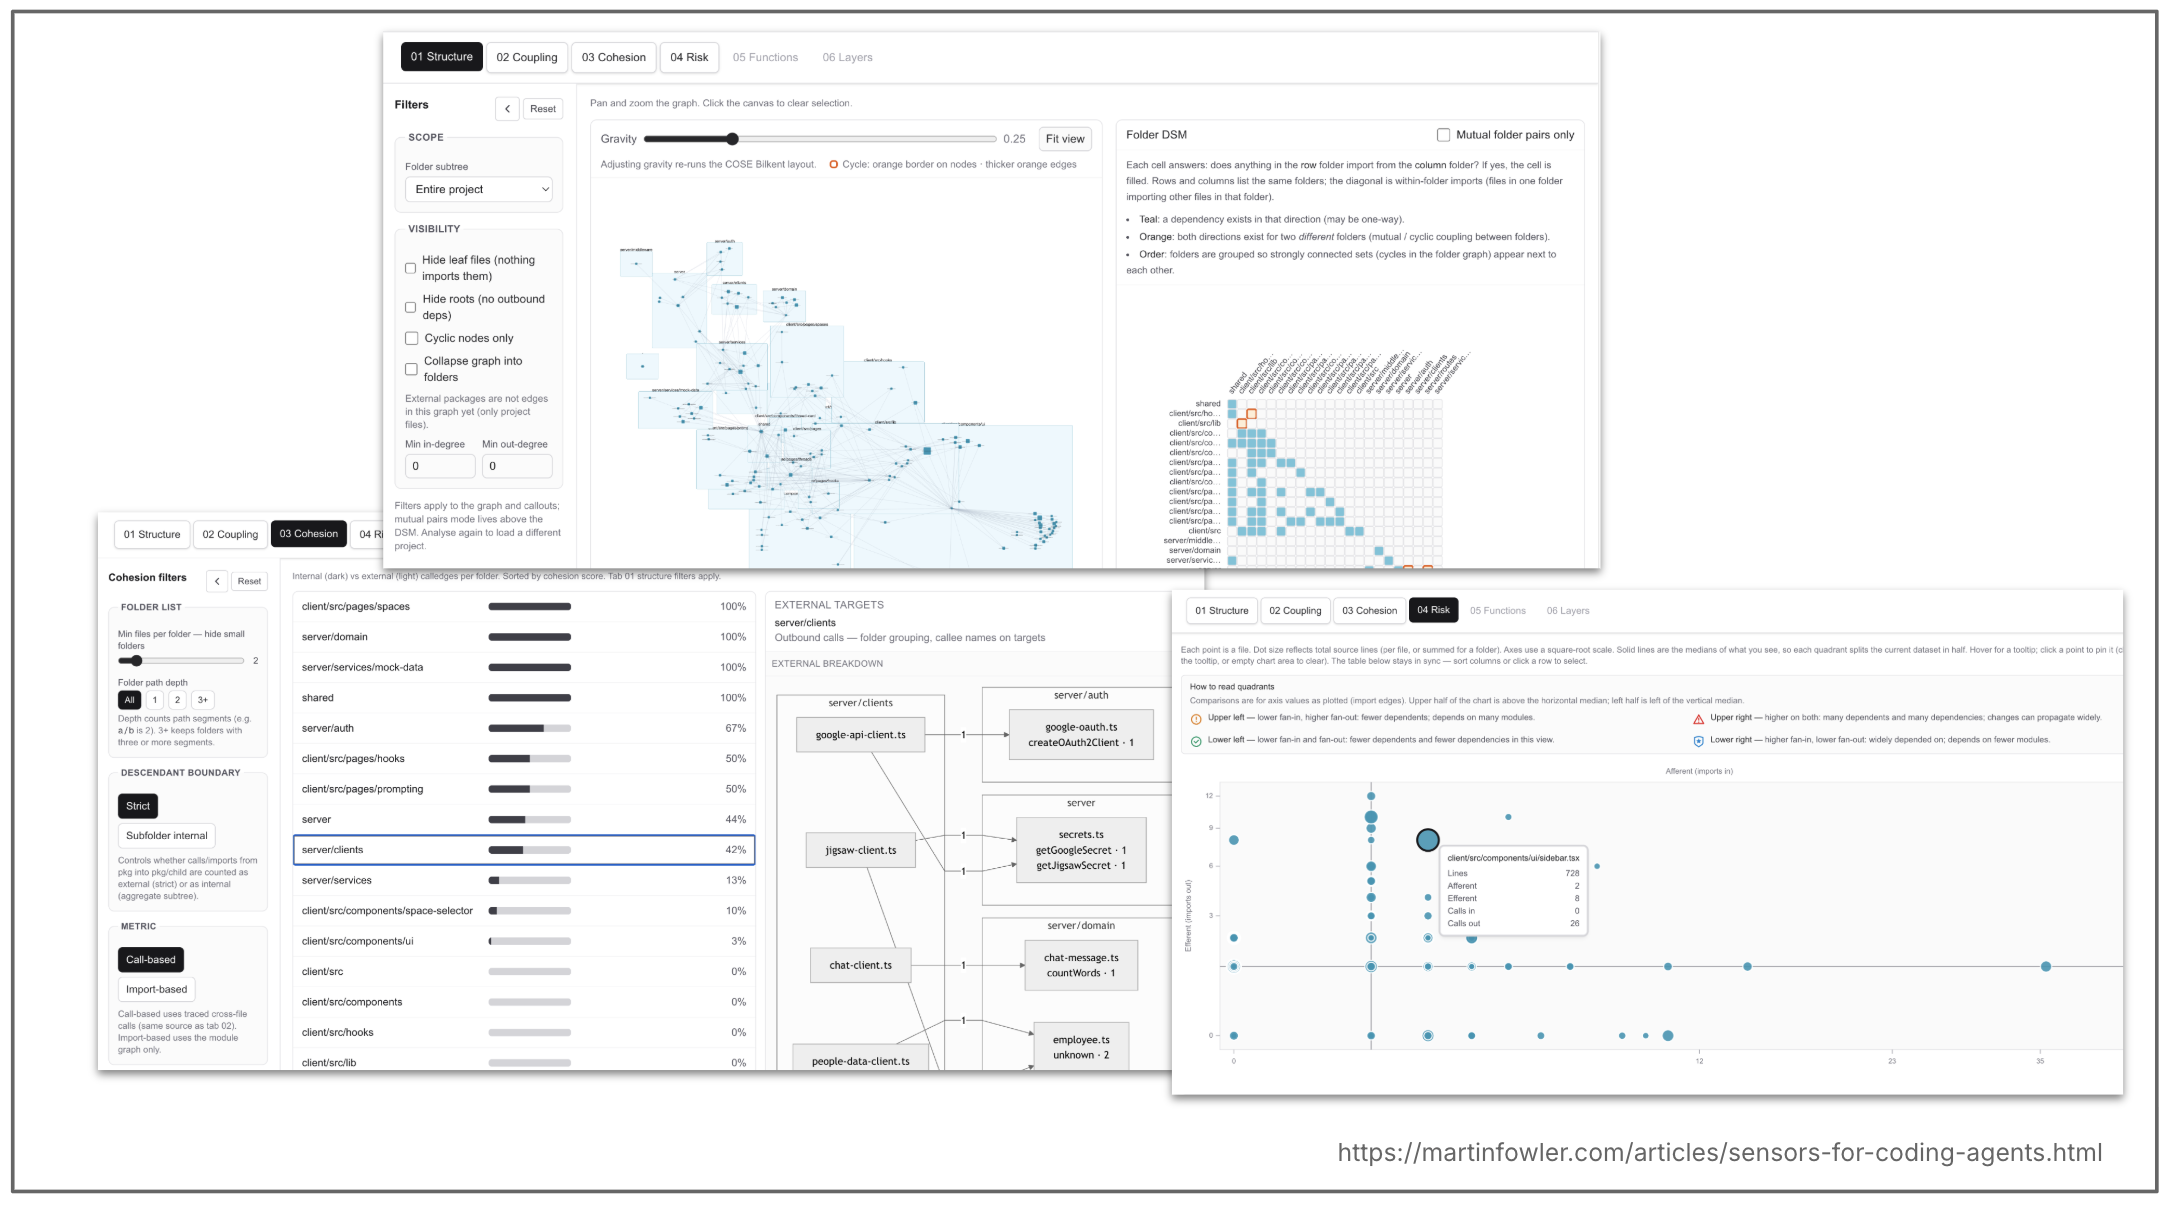
Figure 4:
Coupling metrics: web visualisations and CLI for agents.
For human consumption
Most of these visualisations are well established concepts, like a dependency structure matrix (DSM). I found them tedious to interpret, and even though they were vibe coded and could most certainly be improved, I think that had more to do with the nature of the data. It’s quite detailed data that needs a lot of context and experience to interpret it, and map it back to more high level good practices. So I have a feeling that these types of tools still won’t really help reduce a human’s cognitive load much when reviewing codebases that were changed by AI.
For AI consumption
I gave an agent access to this custom CLI (coupling-analyser) and asked it to create a report based on the data, including suggestions of how to improve the critical issues.
Here is an excerpt of what that prompt looked like – I’m mainly reproducing this to show you that I didn’t actually give it much guidance on what good or bad modularity looks like, I mostly delegated to the model to interpret what good and bad looks like:
Produce a markdown report on modularity and coupling quality for the target TypeScript codebase, grounded in actual CLI output from npx coupling-analyser, not guesswork from static browsing alone.
Gather evidence (run the CLI)
Execute the CLI and capture stdout. Use the report subcommands—combine as useful for the question:
…
Write the markdown report
Use clear headings. Prefer concrete module IDs / paths and numbers quoted or paraphrased from CLI output.
Suggested sections:
-
Context — What was analyzed
-
Executive summary — 2–5 bullets: overall modularity posture, top 1–3 systemic issues.
-
Findings from the tool — Summarize hotspots, top risks, notable cycles or mutual dependencies, and behavioural highlights as reported by the CLI.
-
Interpretation (modularity lens) — Tie metrics to software design: cohesion vs. spread of change, stability vs. dependency direction, fan-in/fan-out intuition, cycle impact.
-
Deep dives for each high and critical issue
- What it is — Module(s), role in the system, dependency neighbours (from CLI + minimal code peek if needed).
- Responsibilities today …
- Why it hurts …
- Design options (2+ where reasonable) …
- Why the new design is better — Fewer cycles, clearer dependency direction, smaller surfaces, test seams, align with likely change vectors.
- Future change risk — How each option reduces regression risk and makes safe evolution cheaper (concrete scenarios: “adding X”, “swapping Y”, “shipping Z independently”).
…
This LLM-led analysis actually pointed me to the same coupling hot spots that I would have found by looking through the visual diagrams, just in a format that was more digestible. And asking the LLM to ground its analysis in the results from the deterministic tool gave me a higher level of confidence, and probably also used less time and tokens than if the agent had scanned the codebase itself to find coupling problems.
Observations
What the LLM found based on this data was quite lackluster (I used Claude Opus 4.7 for this):
- It said one of the biggest issues was a factory that initialises all the necessary components, but I had introduced that factory on purpose as a component that acts like a lightweight dependency injection framework.
- Another issue it had was with a shared (
zod) schema between frontend and backend, declared a “god module” by the LLM. This is a common pattern though to create an explicit contract between backend and frontend, and is not as much of an issue when backend and frontend evolve together anyway, or even live together in the same repo, like in my case. - When legitimate patterns appear as high-coupling hubs, there would have to be a way to suppress those in future analyses, otherwise they create even more noise.
- The one kind of interesting finding it had: An
index.tsfile in the domain folder indiscriminately exposed all files in./domain, and is imported by lots of places. While that is also a common pattern to create explicit contracts for a layer, it does have its pros and cons, and is at least worth an investigation to see if it is appropriate for this codebase.
Main takeaways
The examples above show that even more so than with the basic linting, good and bad does not have a clear definition, instead it is all about what is appropriate. And what coupling is appropriate depends on a lot of context, not just the raw call and import graph of a codebase. So based on this small experiment, I don’t have the impression that this type of coupling data is useful to AI on its own.
A more practical use I can imagine for this data is during risk triage for code review. When I review a code change made by AI, it seems useful to know what the impact radius of the changed files is, so that I can pay more attention when e.g. a file with 10+ callers is changed. Or an AI review agent could use the data to prioritise where it spends its tokens.
Static code analysis: AI modularity review
The lackluster results from the coupling data experiment could have multiple reasons:
- My prompt about what to analyse was not very specific
- The coupling data is not useful to AI
- The coupling data only is too shallow and lacks context of the full code
So the final thing I did was to go fully down the inferential route and use Vlad Khononov’s “Modularity Skills” to analyse the codebase design and find modularity issues. This proved to be very fruitful! It gave me lots of interesting pointers for refactorings that would obviously reduce the risk of future changes. I ran the skills a second time and gave them access to my coupling analysis CLI. The AI mostly found confirmation in the data, but not any additional findings. On the contrary, it pointed out lots of things that the CLI was missing. It’s also worth noting that the second run of the analysis (without context of the first one) surfaced yet another issue that the first run did not find. A useful reminder that when it matters, it’s often worth running an LLM-based analysis multiple times, to get a fuller picture.
Observations
Here are some highlights from the results (model used was Claude Opus 4.7, same as for the coupling analysis):
- Duplicate route code – all my three backend endpoints had their own route file, and each of those route implementations was almost identical. So whenever I would want to introduce a change to the general principles of the backend API (let’s say introducing a request ID, or changing the error handling or logging approach), I’d have to do it in multiple files. I had only just introduced a third endpoint, so I think it’s fair enough that this wasn’t abstracted out yet. But in my experience, AI agents usually don’t go ahead and start refactoring without an explicit nudge when they repeat a piece of code for the third or fourth time, they are quite happy to copy and paste.
- Inconsistency in calling the backend – or put another way, yet another form of semantic duplication. I have 3 pages in the application that need to call the backend with the same set of parameters (selected chat space, and which date range to analyse). Two of those pages were using the same hook and general approach to do this, but when AI introduced the third page, it deviated from that and reimplemented similar behaviour in its own way. This can e.g. lead to inconsistencies in error handling, or again the need to change multiple files when backend API principles change.
- Inefficient handling of the core arguments – As just mentioned, all the pages in the application pass on a chat space ID and a date range to the backend. I had already noticed when I changed the way a user can specify a date range that AI had to change a lot of files for that change – over 40! So I was already aware that something was fishy here, and the analysis confirmed it: “Issue: Request parameters repeated at every level”. The recommendation was to introduce an object that wraps all of these parameters. AI had already done that in a way – but never fully followed through with the usage of that object, so it was an inconsistent mess.
- Responsibilities in the wrong place – The review found a bit of authentication code sitting inside our factory that was supposed to only be responsible for wiring up our modules. It implemented a fallback to mock data when the user is not authenticated. An unexpected location like that creates a risk of being missed when new routes are added.
- Better interpretation of acceptable high-import-count “hubs” – Remember the “god classes” found by my previous coupling analysis? The modularity skills also noticed these, but in both cases nicely pointed out that they have a purpose in the context of this application. I assume that is either due to the good prompting in these skills, or due to the fact that this analysis actually read what was in the code, whereas I asked the other one to only rely on the coupling data.
Main takeaways
- Dependency parsers like
dependency-cruisercan be effective live sensors to enforce some basic folder structures and dependency directions, but they can only go so far. - The AI modularity review is a great example of “garbage collection”, and worked quite well when given powerful prompts. Grounding it in actual coupling data didn’t seem to make much difference. It would be great to find a way to apply this to the changed files in a commit, to have this earlier in the pipeline, but I did not explore this yet.
- I ran the modularity review after building most of the codebase without applying that type of review myself – and it had some quite concerning and very valid findings that would have increased risk in the future. It shows that without human review and coupling expertise, AND without these extra AI reviews, the agent was definitely compounding inadvertent technical debt.
Overall, codebase design and modularity seems like a concern where computational sensors alone cannot help us much, AI is needed to add semantic interpretation, and consider trade-offs.


Speak Your Mind